Issues Analytics (PREMIUM)
Introduced in GitLab Premium 11.5.
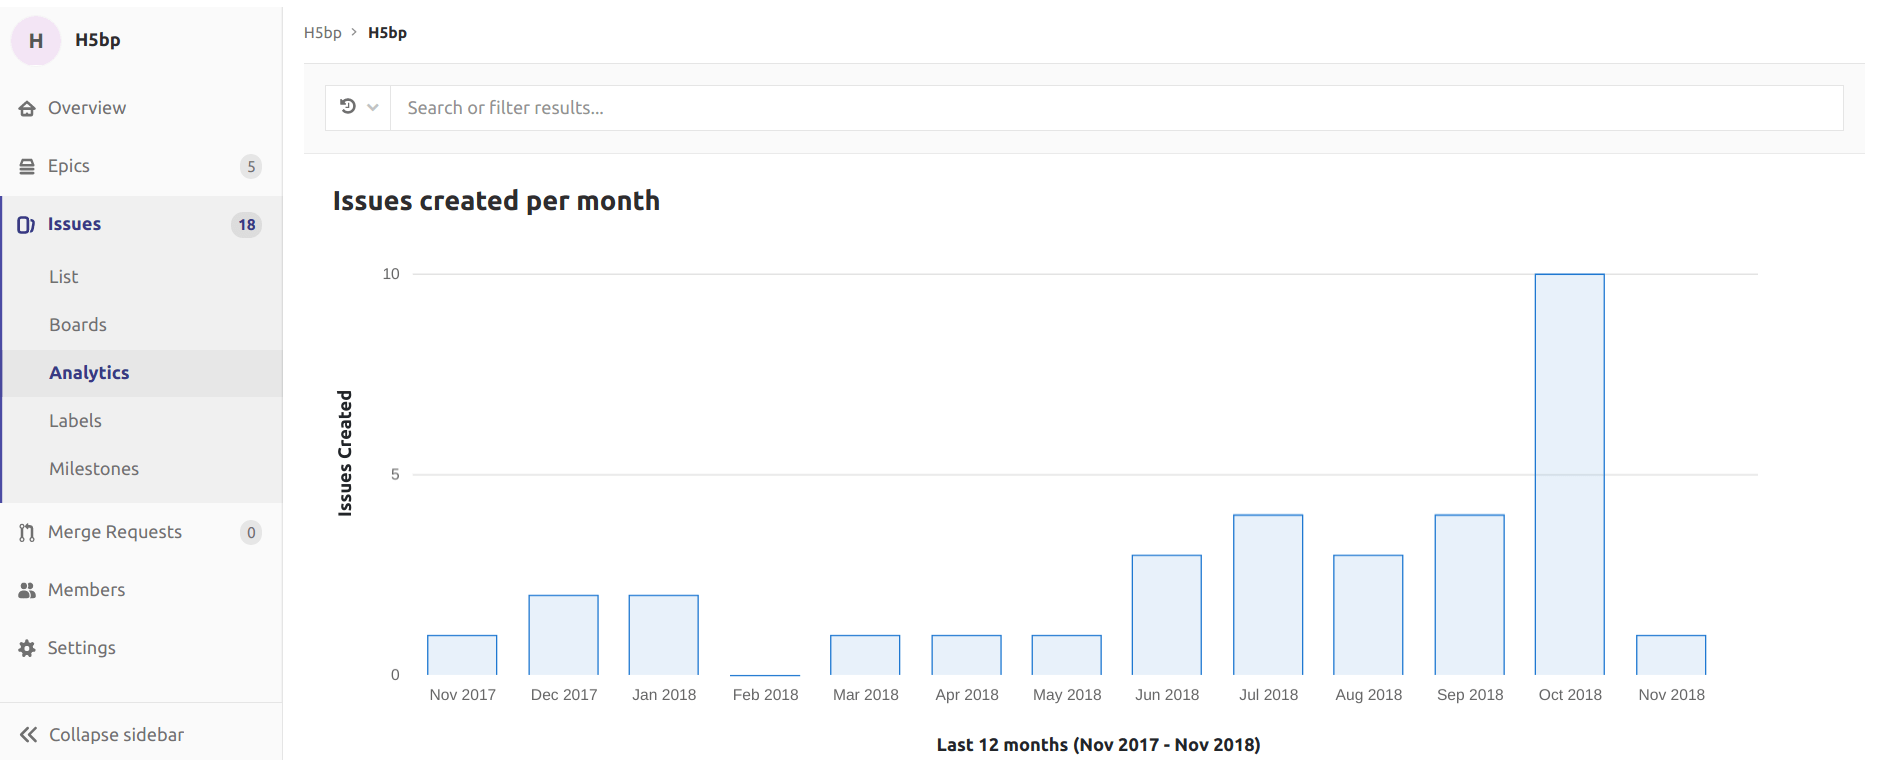
Issues Analytics is a bar graph which illustrates the number of issues created each month. The default timespan is 13 months, which includes the current month, and the 12 months prior.
To access the chart, navigate to a group's sidebar and select Issues > Analytics.
Hover over each bar to see the total number of issues.
To narrow the scope of issues included in the graph, enter your criteria in the Search or filter results... field. Criteria from the following list can be typed in or selected from a menu:
- Author
- Assignee
- Milestone
- Label
- My reaction
- Weight
You can change the total number of months displayed by setting a URL parameter.
For example, https://gitlab.com/groups/gitlab-org/-/issues_analytics?months_back=15
shows a total of 15 months for the chart in the GitLab.org group.