GitLab Security Dashboard (ULTIMATE)
The Security Dashboard is a good place to get an overview of all the security vulnerabilities in your groups, projects and pipelines.
You can also drill down into a vulnerability and get extra information, see which project it comes from, the file it's in, and various metadata to help you analyze the risk. You can also action these vulnerabilities by creating an issue for them, or by dismissing them.
To benefit from the Security Dashboard you must first configure one of the security reports.
Supported reports
The Security Dashboard supports the following reports:
- Container Scanning
- Dynamic Application Security Testing
- Dependency Scanning
- Static Application Security Testing
Requirements
To use the instance, group, project or pipeline security dashboard:
- At least one project inside a group must be configured with at least one of the supported reports.
- The configured jobs must use the new
reportssyntax. - GitLab Runner 11.5 or newer must be used. If you're using the shared Runners on GitLab.com, this is already the case.
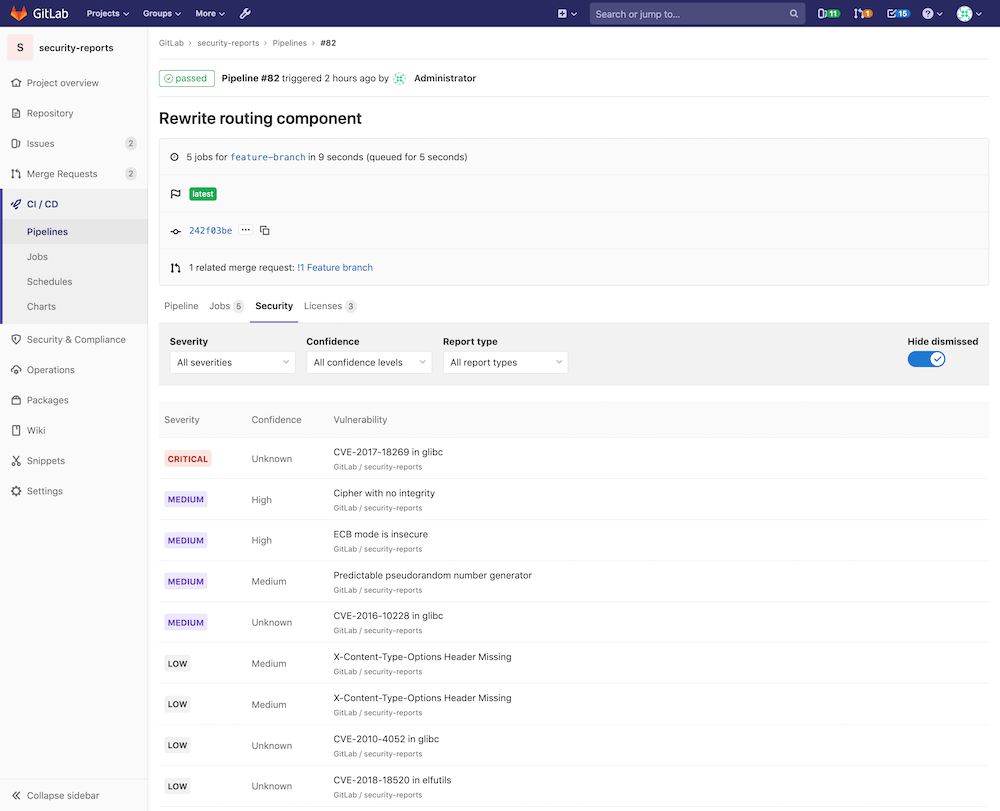
Pipeline Security Dashboard
Introduced in GitLab Ultimate 12.3.
At the pipeline level, the Security Dashboard displays the vulnerabilities present in the branch of the project the pipeline was run against.
Visit the page for any pipeline which has run any of the supported reports. Click the Security tab to view the Security Dashboard.
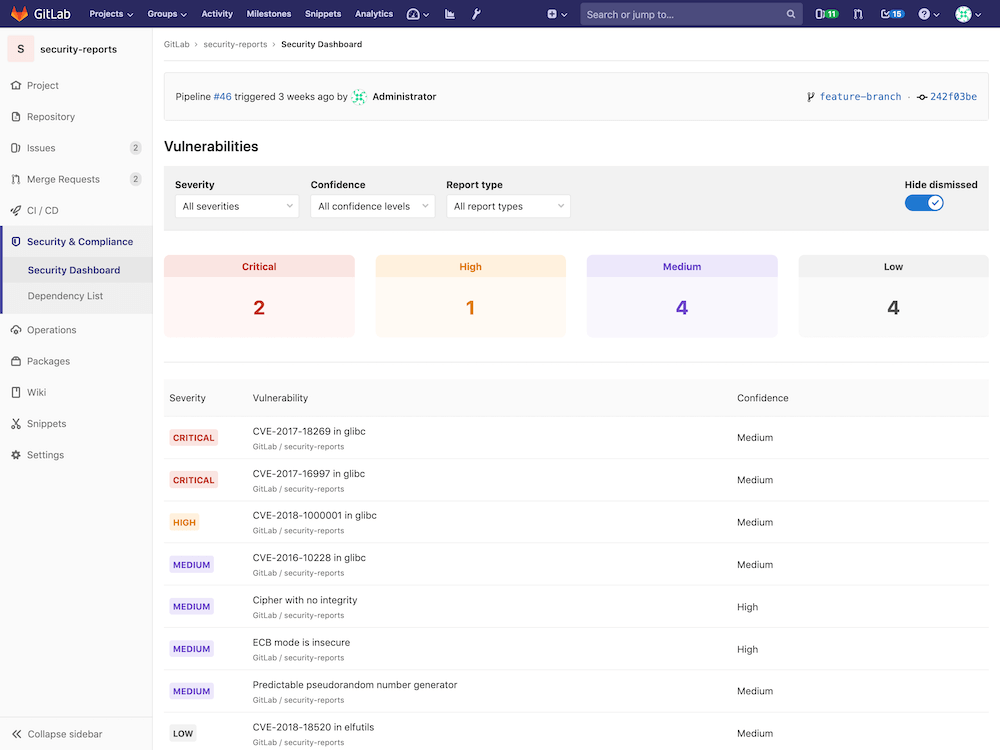
Project Security Dashboard
Introduced in GitLab Ultimate 11.1.
At the project level, the Security Dashboard displays the latest security reports for your project. Use it to find and fix vulnerabilities affecting the default branch.
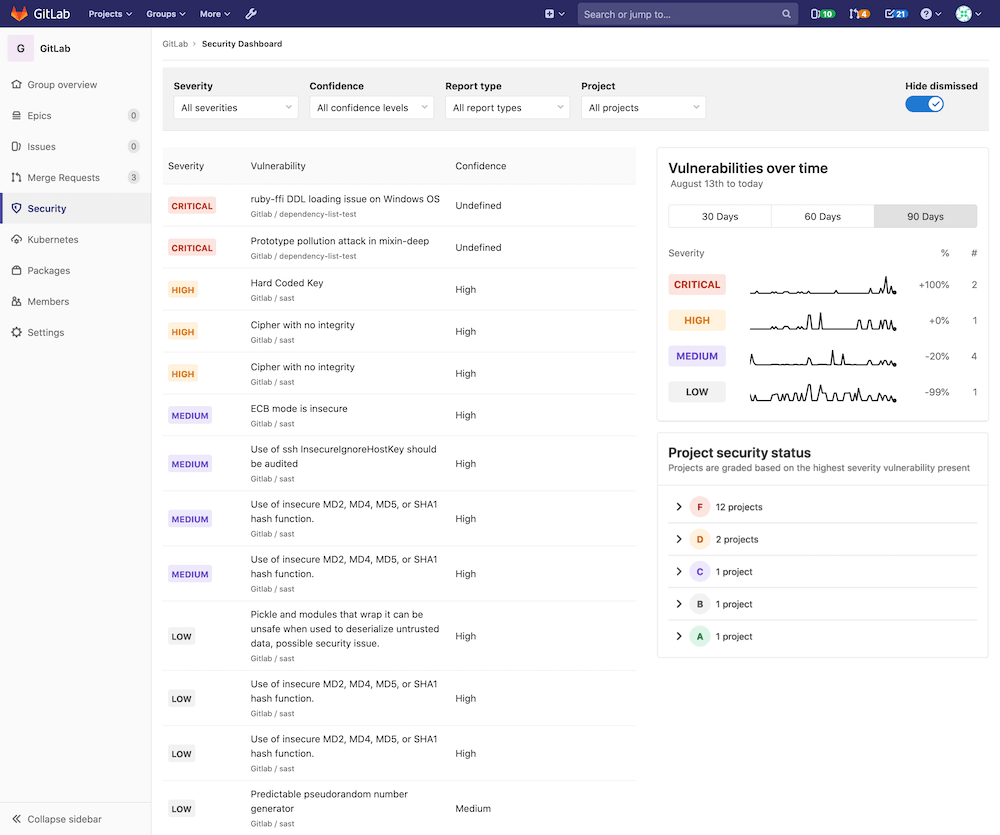
Group Security Dashboard
Introduced in GitLab Ultimate 11.5.
The group Security Dashboard gives an overview of the vulnerabilities of all the projects in a group and its subgroups.
First, navigate to the Security Dashboard found under your group's Security tab.
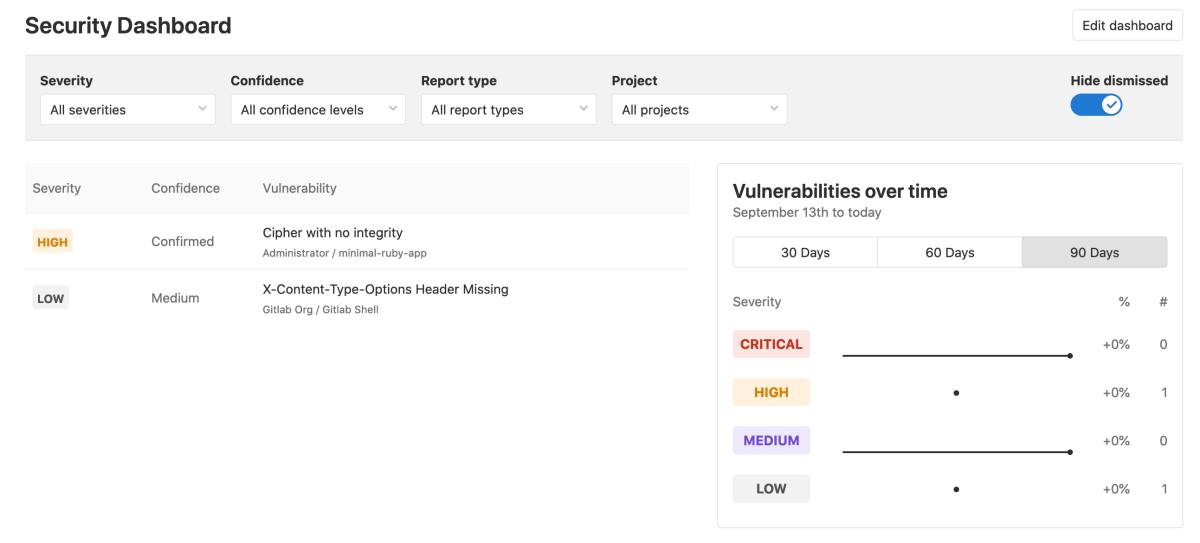
Once you're on the dashboard, at the top you should see a series of filters for:
- Severity
- Confidence
- Report type
- Project
To the right of the filters, you should see a Hide dismissed toggle button.
NOTE: Note: The dashboard only shows projects with security reports enabled in a group.
Selecting one or more filters will filter the results in this page. Disabling the Hide dismissed toggle button will let you also see vulnerabilities that have been dismissed.
The main section is a list of all the vulnerabilities in the group, sorted by severity. In that list, you can see the severity of the vulnerability, its name, its confidence (likelihood of the vulnerability to be a positive one), and the project it's from.
If you hover over a row, there will appear some actions you can take:
- "More info"
- "Create issue"
- "Dismiss vulnerability"
Next to the list is a timeline chart that shows how many open vulnerabilities your projects had at various points in time. You can filter among 30, 60, and 90 days, with the default being 90. Hover over the chart to get more details about the open vulnerabilities at a specific time.
Below the timeline chart is a list of projects, grouped and sorted by the severity of the vulnerability found:
- F: 1 or more "critical"
- D: 1 or more "high" or "unknown"
- C: 1 or more "medium"
- B: 1 or more "low"
- A: 0 vulnerabilities
Projects with no vulnerability tests configured will not appear in the list. Additionally, dismissed vulnerabilities are not included either.
Read more on how to interact with the vulnerabilities.
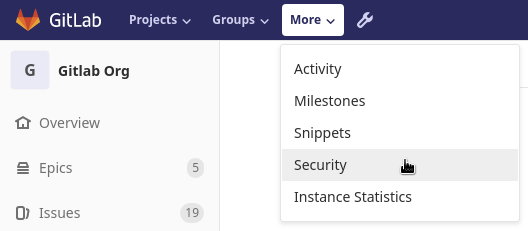
Instance Security Dashboard
Introduced in GitLab Ultimate 12.7.
At the instance level, the Security Dashboard displays the vulnerabilities present in all of the projects that you have added to it.
You can access the Instance Security Dashboard from the menu bar at the top of the page. Under More, select Security.
Adding projects to the dashboard
To add projects to the dashboard:
- Click the Edit dashboard button on the Instance Security Dashboard page.
- Search for and add one or more projects using the Search your projects field.
- Click the Add projects button.
Once added, the dashboard will display the vulnerabilities found in your chosen projects.
Keeping the dashboards up to date
The Security Dashboard displays information from the results of the most recent security scan on the default branch, which means that security scans are performed every time the branch is updated.
If the default branch is updated infrequently, scans are run infrequently and the information on the Security Dashboard can become outdated as new vulnerabilities are discovered.
To ensure the information on the Security Dashboard is regularly updated, configure a scheduled pipeline to run a daily security scan. This will update the information displayed on the Security Dashboard regardless of how often the default branch is updated.
That way, reports are created even if no code change happens.
Security scans using Auto DevOps
When using Auto DevOps, use special environment variables to configure daily security scans.